PROJECTS
Projects in PRES 745 include 3D laser scans of the Owens Thomas House basement, structure-from-motion documentation and 3D printing, Sketchfab production and data visualization for the Historic Macon Foundation. Plus a bonus visit from Hurricane Matthew.
Latest Projects

3D Laser Scanning at Owens Thomas House
Here's a great page from The Scottish Ten's website that explains 3D laser scanning in detail (click unerlined link). The Faro Focus scanner is portable, and an efficient tool for quickly recording existing conditions in interior and exterior settings. Downsides to the Faro Focus are the expense of the equipment and the limitations of certain materials for scanning, e.g. the scanner does not do well with extremely shiny, porous or transparent surfaces.
The processing of the data takes some time; allowances must be made for data processing time after the scans are collected. The 3D laser scanning project at Owens Thomas House went quickly. Twenty scans in total were made with the Faro Focus 3D Laser Scanner, and each scan's location was noted on a sketch of the basement floor plan. The Faro Focus scanned data onto an SD card, which was then loaded onto Dropbox to be shared with the class.
Here are the steps to laser scan and process the data:
-
Make a sketch of the area(s) to be scanned and develop a preliminary Idea of where to place the scanner so that the scanned areas will overlap by 30 percent or so, allowing registration of the scans.
-
Keep a record of each scan, the settings of the device and the location of the scanner.
-
Perform each scan, quickly leaving the area so as not to 'show up' an the scan data.
-
Import the scan data into Faro Scene software, and apply the color photographs the laser scanner took onto the point cloud data (right click>operations>color/pictures>apply pictures).
-
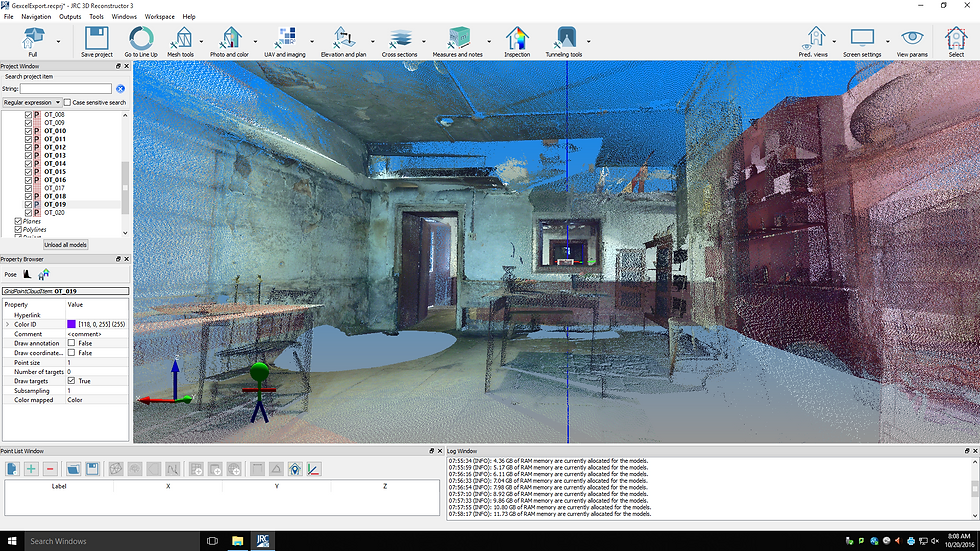
Next, export the data into JRC Reconstructor software(click on Gexcel dropdown>go to Reconstructor) and process the data, making sure the export color and reflectance boxes have been checked. A 'P' appears by each scan when the data is properly processed.
-
Next, clean up the images and remove extraneous points, either by lassoing them or enclosing them in a bounding box and deleting information either inside or outside of the bounding box. If points are mistakenly deleted, this action can be undone by right clicking, going to 'point filtering and clustering' and selecting 'restore deleted points.' Make sure the 'color' option is selected on the dropdown menu.
-
Next stitch the edited point clouds together by manually registering various points (usually 3 points) accurately on a pair photographs in JRC Reconstructor to create a manipulatable 3D image. One image is the 'reference', and one the 'moving grid.' Once an image is used as a reference grid it can never be used as a moving grid. This requires one to to methodically work around the project, thinking ahead to which scans will be used for reference grids and which will be the moving grid in a way that makes sense. The two grids, reference and moving, appear on the same screen. On the upper left hand corner of both grids is a movable box (a small window) that shows detail of the scan, and allows for zooming in to capture matching points on each image to ensure matching placement of registration points.
-
Register the scans to a mean registration, or tolerance, of .5 or below.
-
After the photos are registered properly, they are then registered in a 'cloud to cloud' registration (this function is on the dropdown menu on the top toolbar), and finally bundled together. All cloud-to-cloud scans are then made into a single 'clustered cloud,' which appears in JRC Reconstructor in the Unstructured Point Clouds layer(shown at the left side of the screen). To make the data in this layer easier to move around and view, change the viewing settings to 5 million points from 40 million points in the view settings dropdown menu.
-
Next, the bundled 'clustered cloud' is placed on a UCS, or universal coordinate system and placed on a plane.
-
This 'posed' single cloud is then saved as a '.e57' type file.
-
Finally, this .e57 file is imported into Autodesk Recap data viewing software. Upon importing, the .e57 file produces two new files, a .rcs and a .rcp (or Recap) file. The step-by-step process is illustrated in the following photos. The process is also discussed in my blog posts.

This is a plan view of OTH from the HABS drawings in the Library of Congress.

Here's the rough sketch showing potential scanner locations (red 'x's) and actual scanner locations (black 'x's), with notes on scan settings.
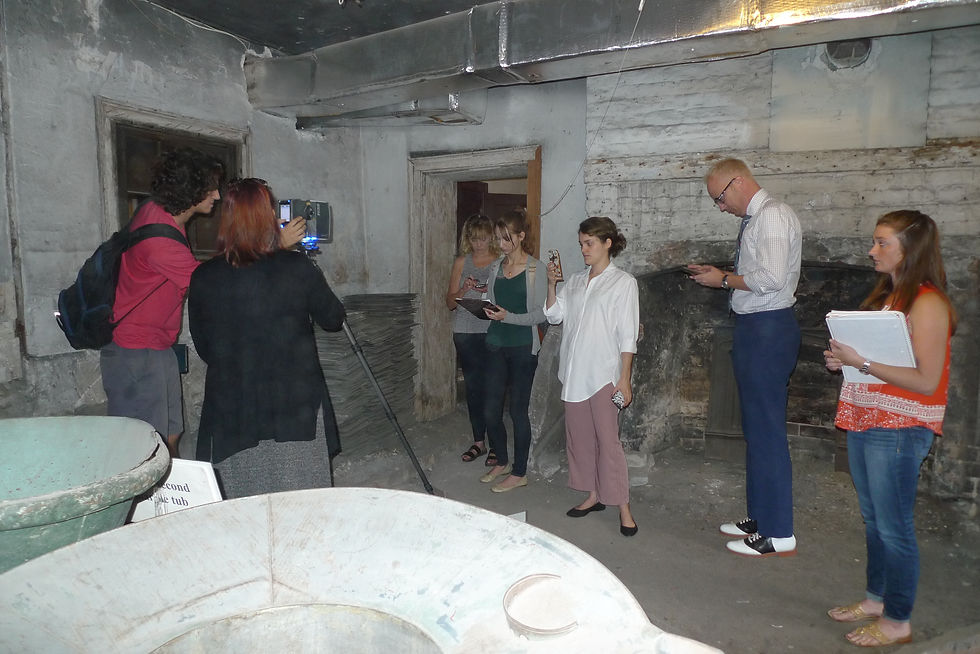
This is showing our team working on Faro Focus 3D laser scan number 18 in the bathing room.
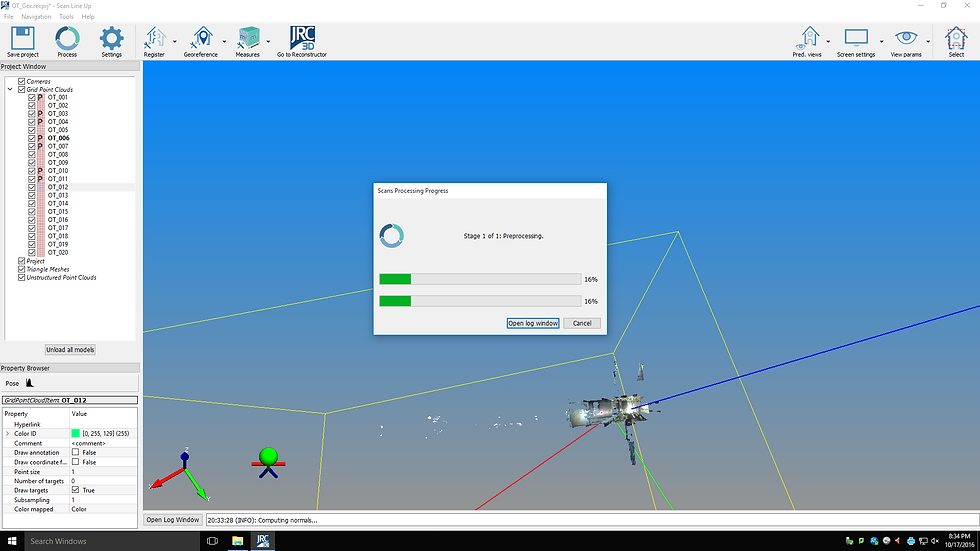
Exporting point scans and photos into JRC Reconstructor. Note the white bits: they represent extraneous points that need to be 'cleaned up' and removed.
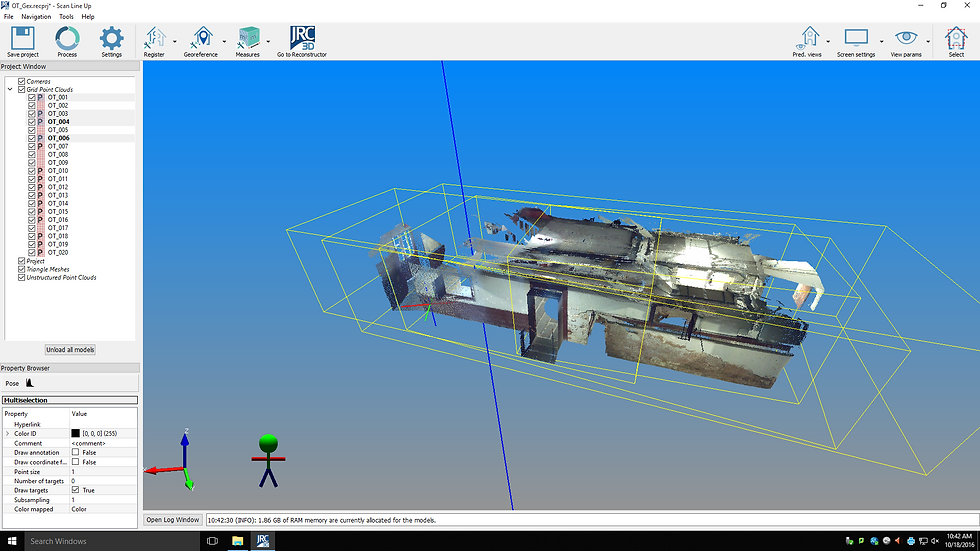
Here four cleaned and registered scans and their bounding boxes are properly aligned in JRC Reconstructor.

Here are the bounding boxes of the registered scans without the point clouds or photograph overlays showing.

This shows all of the scans cleaned and registered together as one 'clustered cloud.'
The clustered cloud is aligned on a grid and the X and Y axes determined manually on the clustered cloud.
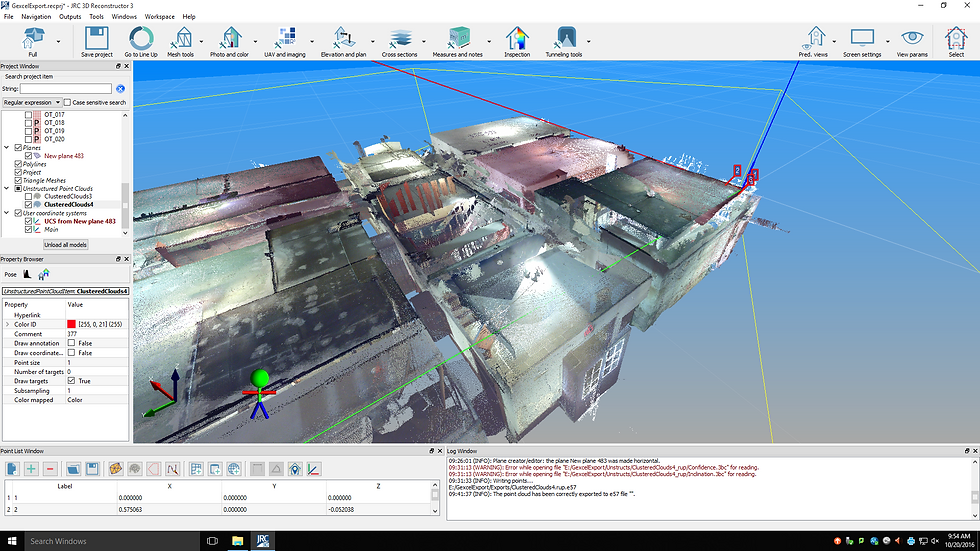
After everything is registered and bundled it's easy to zoom into the 3D representations of the individual rooms.

All the bounding boxes are now one; the images are 'clustered' and bound together, and have been placed on a plane. The bundled 'clustered cloud' file is now ready for export as a .e57 extension for placing into Autodesk Recap viewing software.

The .e57 file has been imported into Autodesk Recap; this creates the final .rcs and .rcp extension files.

Using the Autodesk Recap viewing software it's easy to virtually zoom into each individual room of the project.
Structure-From-Motion and 3D Printing
Autodesk Recap 360 is web-based viewing software that can be used to create the files needed for 3D printing from a composite of photographs. Once an account is created at Autodesk 360, the Autodesk Recap 360 software can be opened and a series of photographs imported. The photographs of the chosen object are best taken in even light; an overcast day is ideal. Harsh shadow patterns are best avoided. It is also necessary to have 360 degrees of accessibility to get photographs of the objects from all sides. One should move around the object twice, taking photographs every ten degrees or so (try to overlap about 50%), changing the angle of the camera with each circumnavigation. Photographs should also be taken from above the object. Very shiny objects won't produce a great result. Structure-from- motion is a great way to quickly and cheaply document objects. It uses ordinary photographs to create a virtual 3D model, making it an affordable option for documenting objects and spaces without the use of an expensive laser scanner. The files generated by Autodesk Recap 360 can be brought into Meshmixer software and further revised (trimmed, base added, holes 'fixed', etc.) before creation of a 3D printed object.
Structure from motion can also be used to document interior spaces. Rather than photographing an object, the room is photographed from the perimeter. Colored paper 'markers' to help with photo registration can be placed on the walls to help ensure an accurate result. The virtual 3D space created by this stitched photo montage can then be viewed and manipulated on the Autodesk Recap 360 software.
Here are the steps to create a 3D print of an object using structure-from-motion:
-
Import photographs of the object into Autodesk ReCap 360.
-
Choose menu options of 'Ultra' for high quality mesh, smart cropping, .fbx, .obj and .rcs formats.
-
Click Submit. Source images will be registered into a 3D composite. This takes a few minutes; Autodesk sends an e-mail when process has completed.
-
Put the Autodesk .fbx, .obj and .rcs files into a folder.
-
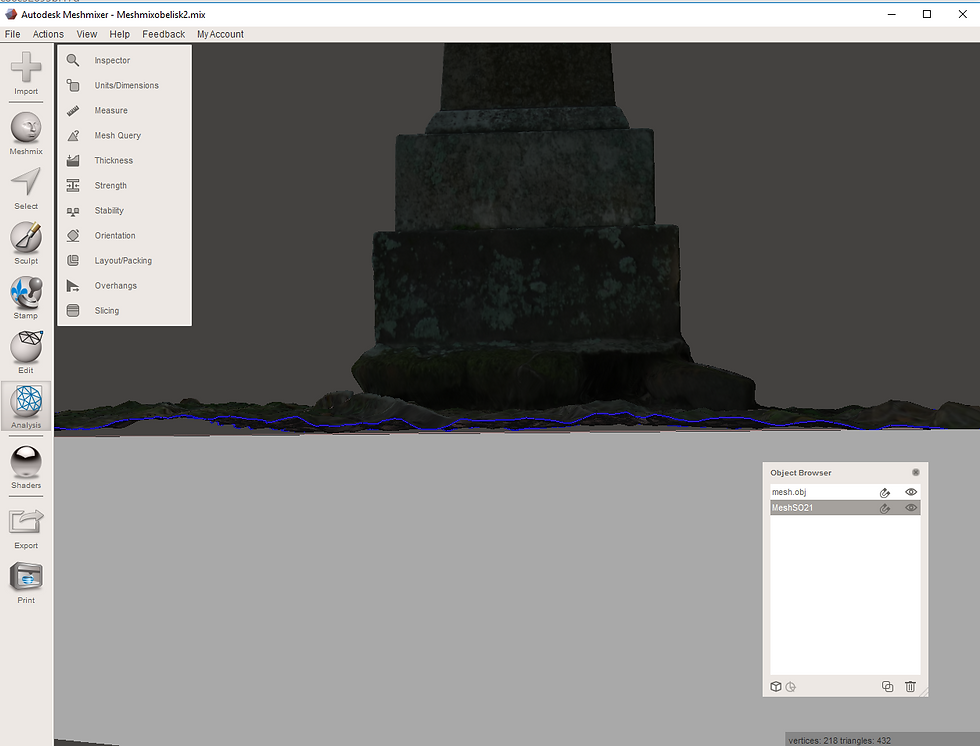
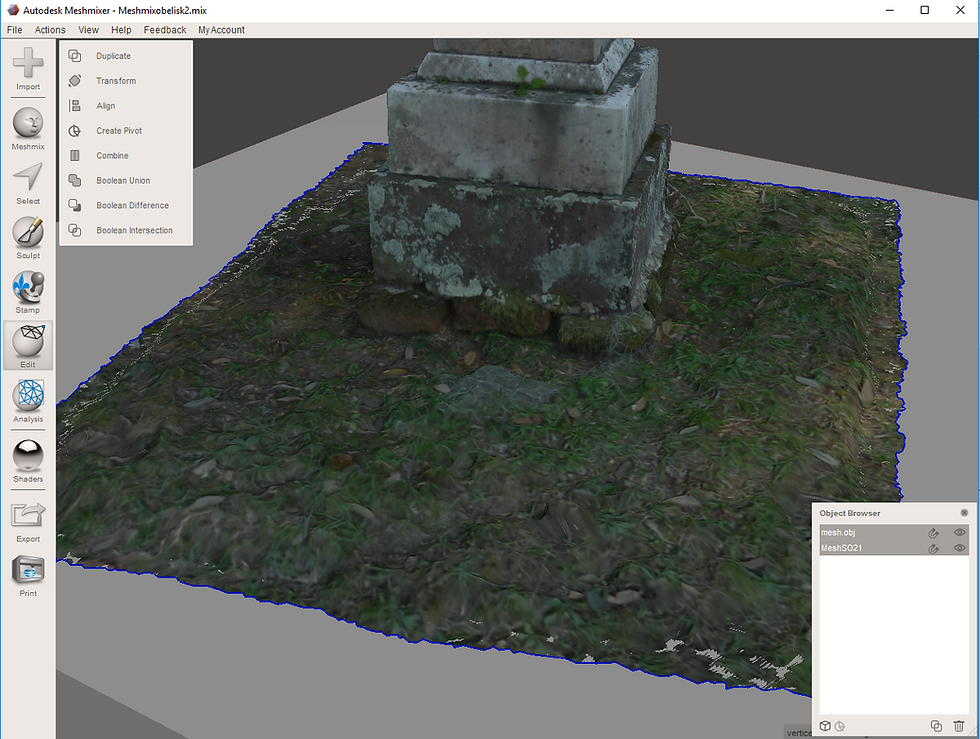
Open Meshmixer and import the .obj file.
-
Configure the unit into inches, and clean up extraneous information by using the brush and lasso options of the selection tool and deleting them.
-
Export the model as an .obj file, which will later be imported into Sketchfab for remote viewing of the object.
-
To prepare the model for 3D printing it must have a base and be made solid, or converted into one piece with no holes.
-
To create a base select the 'Meshmixer' button and choose a base style. Drag the base style into the Meshmixer viewport/work area and move it fairly close to your object. Scale it appropriately, using the sliding X, Y and Z axes arrows, which appear when 'transform' is clicked.
-
Now the object browser window will show two objects. Select the base, and triple-click the magnet icon to activate it. Squiggle lines will eminate from it, indicating it is actively magnetized.
-
Choose 'sculpt,' then 'brush,' then 'attract' to activate the brush. Use the sliders to adjust the size of the brush and the strength of the brush.
-
Run the brush over the edges of the object, 'melting' it onto the base. Flip the object over by right clicking to check that it is completely blended to the base.
-
When finished, triple click the magnetized magnet symbol to neutralize it. Then select both objects in the object browser window by holding down shift and left clicking.
-
Select 'edit' and then 'combine" and finally 'make solid.'
-
Change solid type to accurate on the dropdown, and increase sliders of 'solid accuracy' and mesh density' all the way to the right to get the best detail. Press 'update' button on the bottom to see the changes.
-
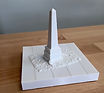
Export the solid model as a .stl file for printing. The 'binary' type of .stl file is a bit smaller, and easier for the staff at a 3D printing center to work with.
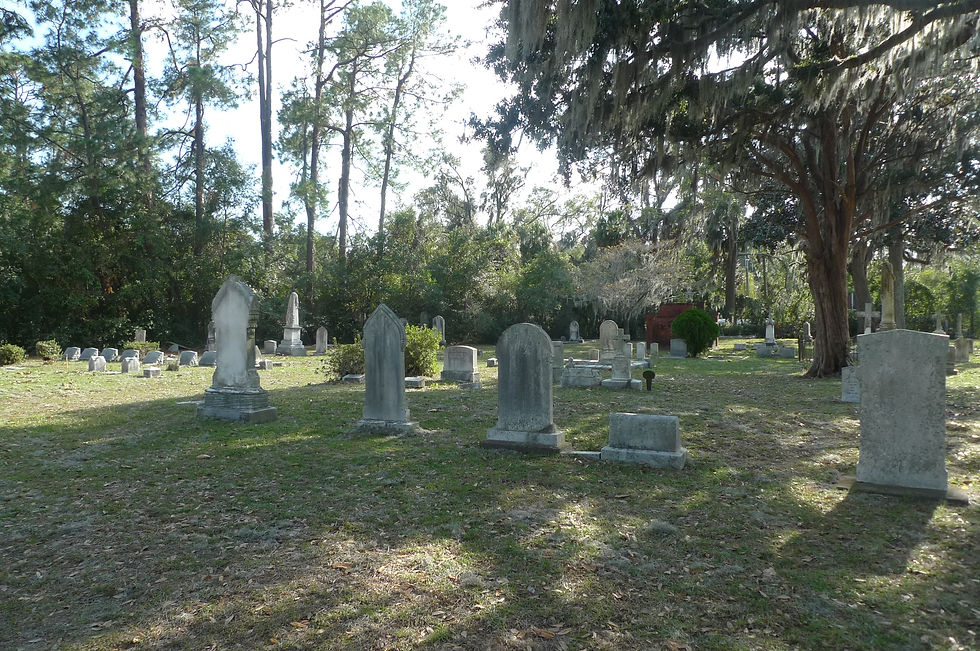
I went looking around for headstones that were accessible from 360 degrees and not in bright sunlight....

I found this obelisk, whick is what I settled on documenting. I took lots of photos from several angles, documenting all surfaces of the obelisk, and made sure the images overlapped.

Here are imported photos loading onto Autodesk 360...

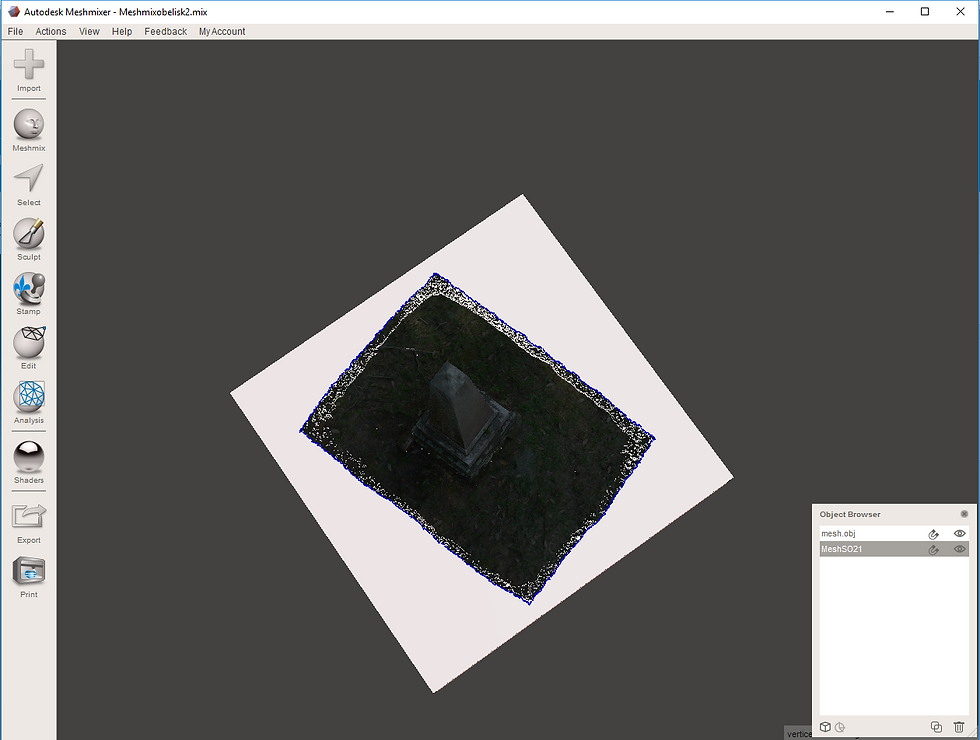
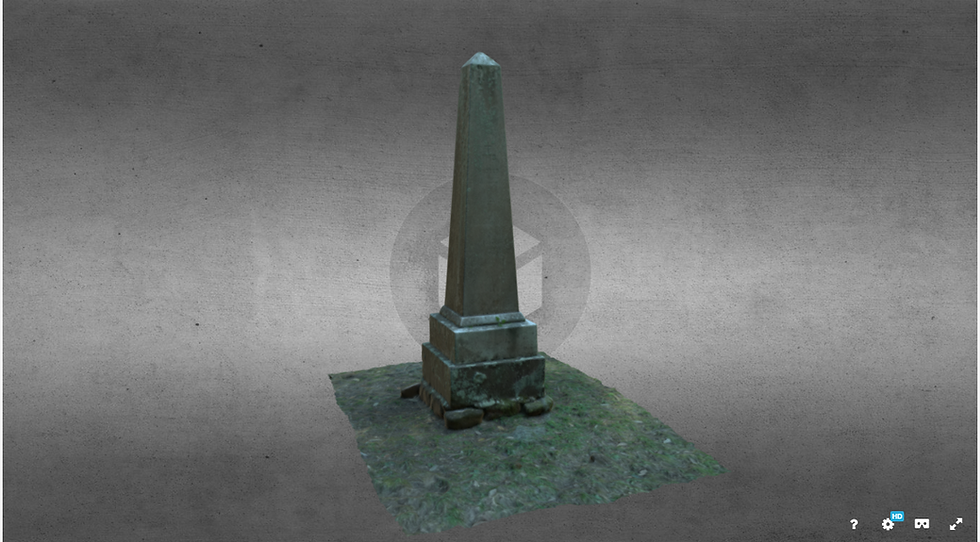
Here is the obelisk in Autodesk 360 as it appears just after loading the images. You can then scroll in and manipulate the 3D image with the mouse...

And zoom in for a closer look. Next, the excess parts of the image are trimmed until you have an 'obelisk on a magic carpet.'
You pull in a base from the meshmixer button of Autodesk, size it to the object (the obelisk) and line the base and object up the way you like, bringing the object very close to the base.

Units are configured into inches to size the overall object's X, Y, and Z axes.

Click on the base in the object browser window and click 3 times on the magnet to magnetize it.

Choose 'sculpt', 'brushes,' 'attract' to activate the little round brush. Change the brush size with the slider sizing tool.
The object is then 'brushed down' onto its base with the 'attract' brush in the 'sculpt' button...
Both objects are selected on the object browser window and made solid.

Here's the print technician at Fahm loading .stl files onto his computer for 3D printing.
Sketchfab
Sketchfab is a website used to display and share 3D content online. It provides a 3D model viewer that can be shared and viewed by invitation. After a free account is created, 'zip' the three files (.obj, ,jpg and .mtl) created by the Autodesk 360 .obj file into a compressed file. Choose the zipped file and import it into Sketchfab. The model will load, but it may not be oriented correctly. Adjust orientation by going into the 'tools' tab, then choose '3D settings' from the dropdown and adjust axis on X, Y and Z axes. In this menu the background can be adjusted. Once you are satisfied with the result, select 'publish.' Invitation to view the model can be sent. It is possible to see how many times the model has been viewed. There is also a 'like' button to track likes. Sketchfab is a great way to share virtual 3D objects with others remotely; anyone can log in to the Sketchfab site and have a look at an object from all sides and angles.
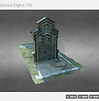
Here is a look at a Sketchfab project:
Here are the steps for loading a Sketchfab model onto the Sketchfab website:

Choose upload on Sketchfab home screen.

Upload the three files in the .obj zip file; .obj, .jpg and .mtl.
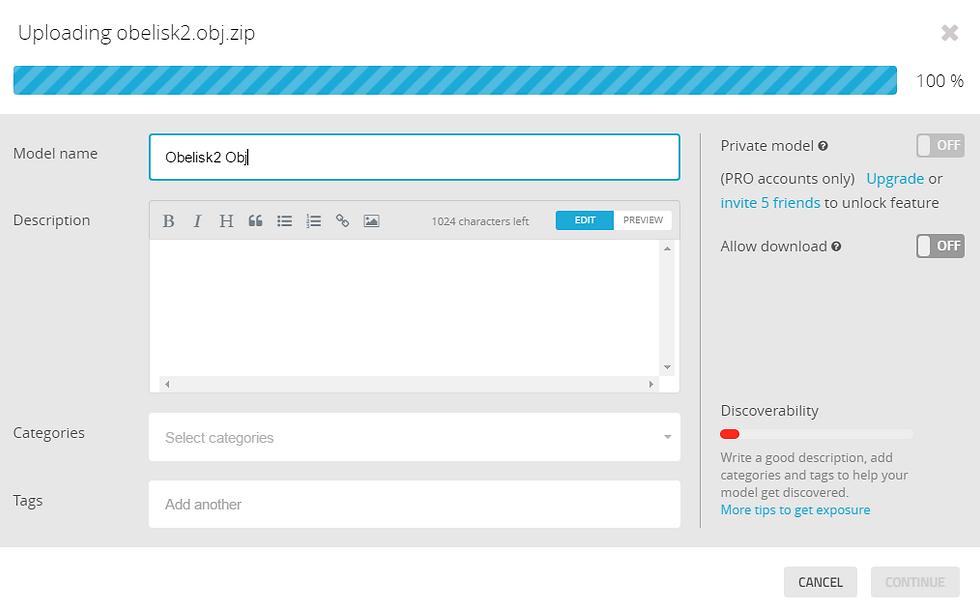
The files load into Sketchfab...
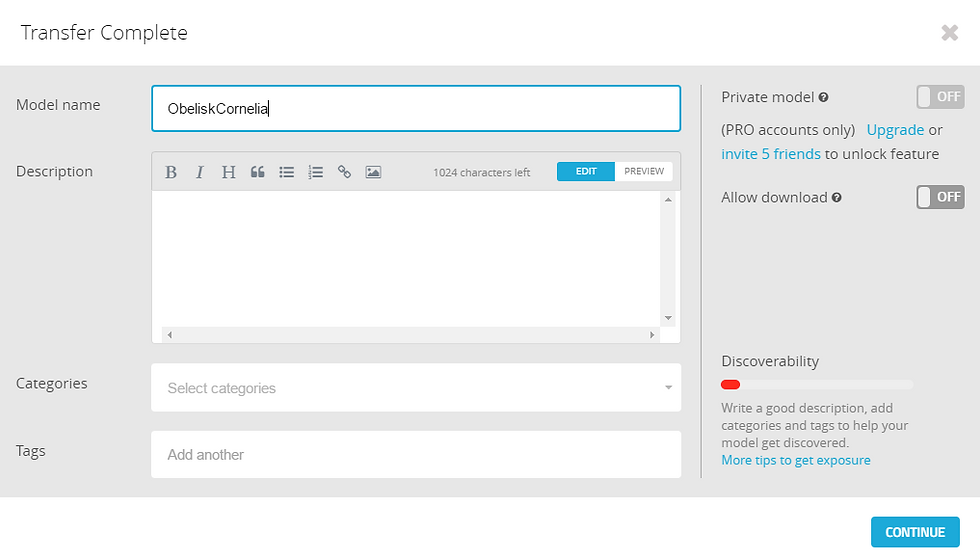
Name the Object you are uploading into Sketchfab.

The object is saved as a draft until edited and published.

Straighten out the object in settings by clicking on X, Y and Z axes. Chang the background in settings as well.
Click 'publish' when you are satisfied with how the object looks on the background.
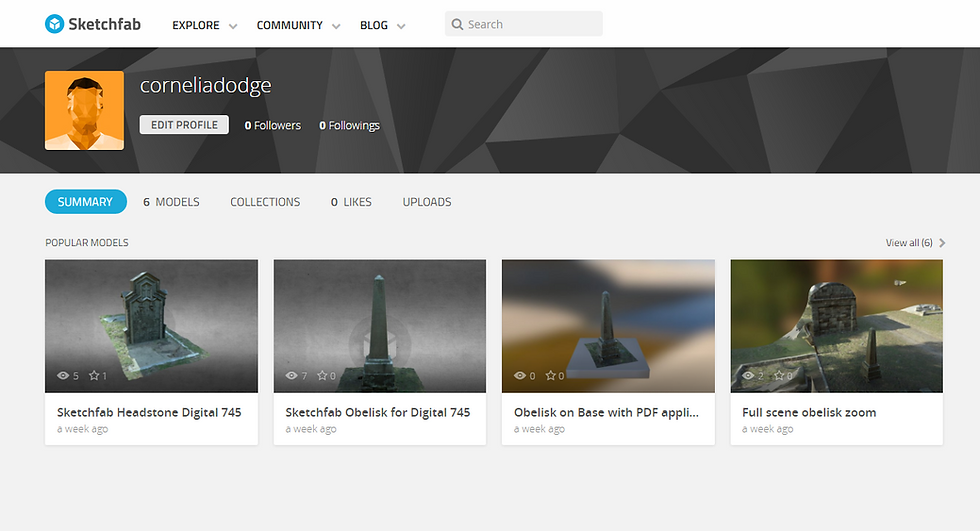
A collection of 3D models may be stored on Sketchfab.

On the lower left 'like' and 'views' are counted on Sketchfab.

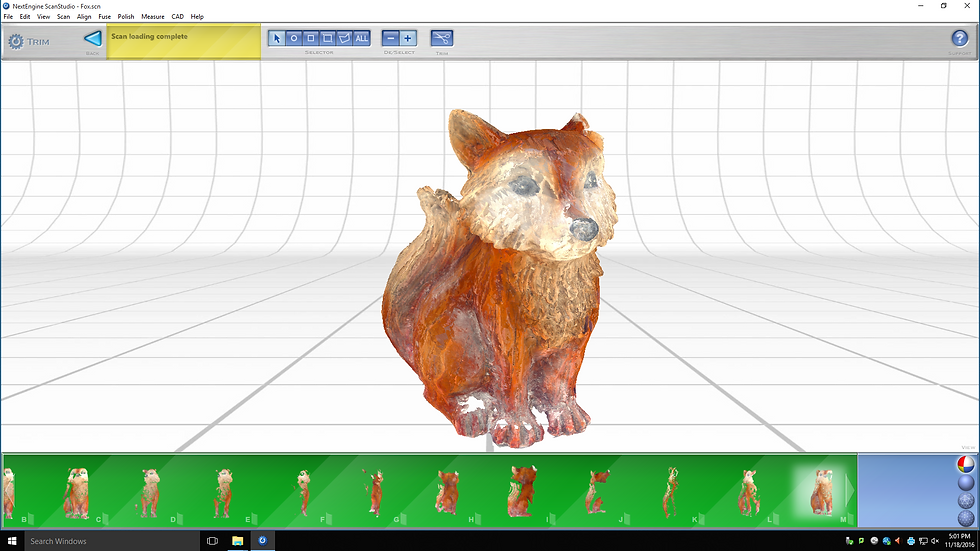
Next Engine Desktop Laser Scanning
The Next Engine desktop laser scanner is a portable, less expensive laser scanning device. It's about the size of an old cassette player. The ScanStudio software must be used with the device hooked up to a computer, which is inconvenient. The NextEngine hardware comes in a box about the size of a carry-on suitcase. Scan data is captured as a set of XYZ points which are then automatically converted into a mesh surface comprised of triangles. This surface can have any texture applied to it, including the photographic color image of the object's surface that is captured at the same time as scanning.
-
To begin, unpack everything and connect the NextEngine scanner to the desktop computer and a power source. Open the ScanStudio software.
-
Place the object to be scanned on the 'platter,' which is connected to the scanner by a wire.
-
ScanStudio has a settings panel that allows you to directly control the scanner instrument to define the type of scan you want.
-
Do a test scan; a preview will show up on the scanner's software: experiment with 'macro,' 'wide,' and 'extended' scanning options to see what works best for your particular object. The wire connecting the platter to the scanning box is stored in such a way that ideal distances from the scanner are indicated by slots corresponding to the software settings (labeled 'macro', 'wide', etc.).
-
Try the settings for 'dark,' 'neutral,' or 'light,' depending on the color of the object. We used 'neutral.'
-
'Quick' quality scans were used for testing. When settings were settled upon, the SD (or 'standard') scan setting was selected. This 'SD' setting yields 4.2K data points per square inch. Higher quality scans may vield more data, but they take a long time to complete.
-
A bounding box is applied around the object displayed in the viewer to help reduce extraneous data.
-
The object is scanned, and rotated by hand in such a way that adequate overlap for scan registration is produced. We rotated the object about 20-plus degrees per scan, and ended up with 14 scans ready for registration.
-
The registration process is straightforward; three red, blue and yellow virtual 'pins' are placed on corresponding areas of each of two scans, which are displayed side-by-side on the software, and then aligned.
-
The aligned scans display as green along the scan ribbon at the bottom of the window.
-
The aligned scans are displayed in sequence, and by the time the last scans are registered, the overlapping data can be hard to interpret for point placement.
-
Excess data is trimmed. We used the polygonal selector tool to lasso excess data.
-
The scans were then 'fused.' The fuse tool creates a mesh from the registered point clouds.
-
Next, the scan is 'polished.' This takes some time.
-
At this point, remaining holes were filled and the object 're-meshed.'
-
Finally the file is exported as an .obj file. You can export your scan data to other systems using a wide variety of output formats including .stl, .obj, and more.

The NextEngine ScanStudio software looks like this.

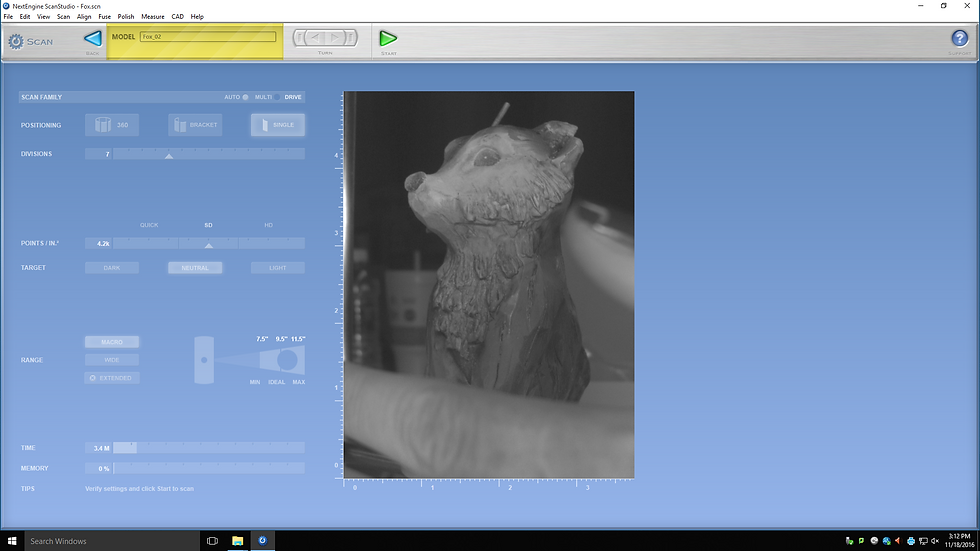
Settings screen shows point density, target color, range of scanner elected and time scan will take.

Here is an image preview of object on scanning plate, ensuring object is placed correctly.
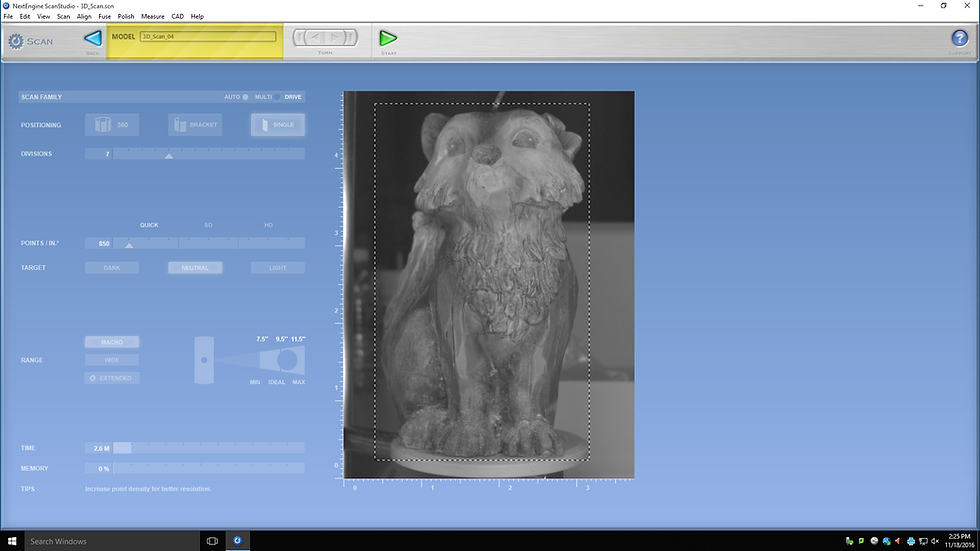
The bounding box is applied to exclude unnecessary data from the scan.
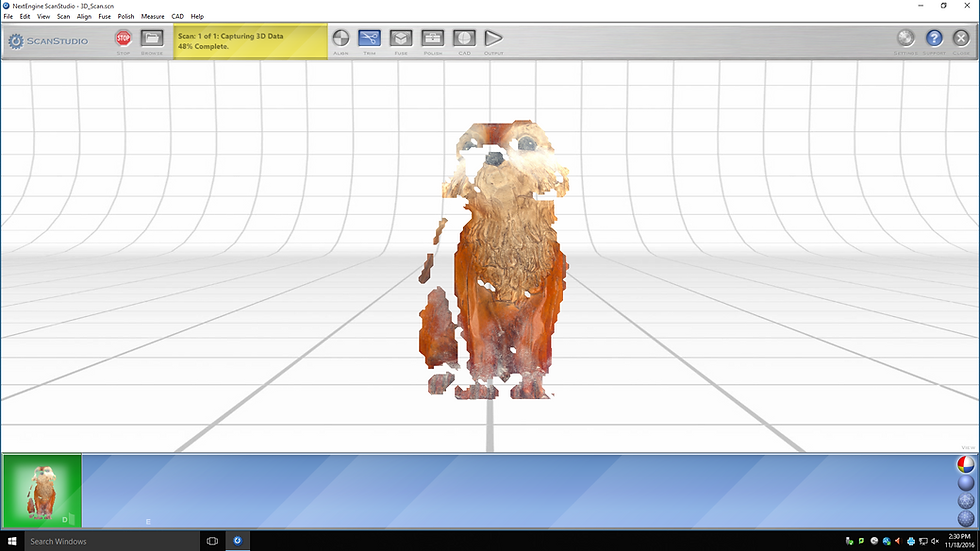
Scan data captured from the first scan shown on ScanStudio screen.

the fourth scan in progress.
The object is rotated about 15 degrees before each new scan until object has been scanned 360 degrees.

Object has been scanned ten times, about halfway through data capture.

After all data is captured, three registration points are matched and aligned on each of two scan data sets.
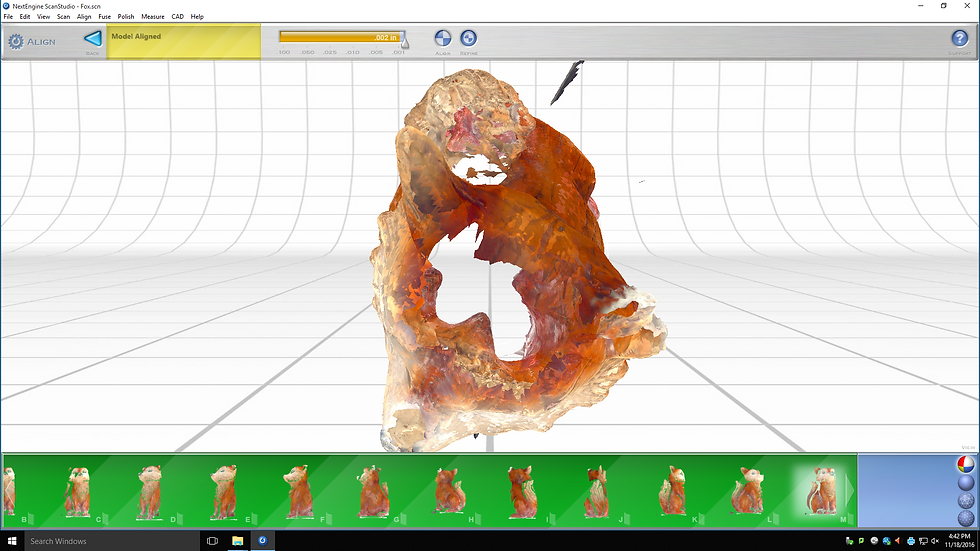
Missing data is evident on the object; this area is scanned and the resulting data registered on the object.

Extraneous data is trimmed from scan data.
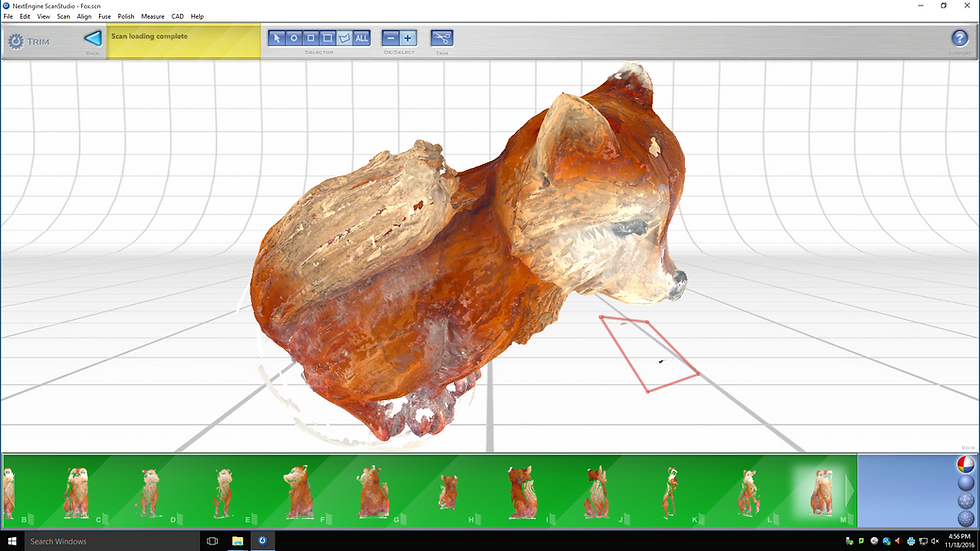
Data is trimmed by lassoing with a polygon and trimming.
The data is registered and trimmed here.
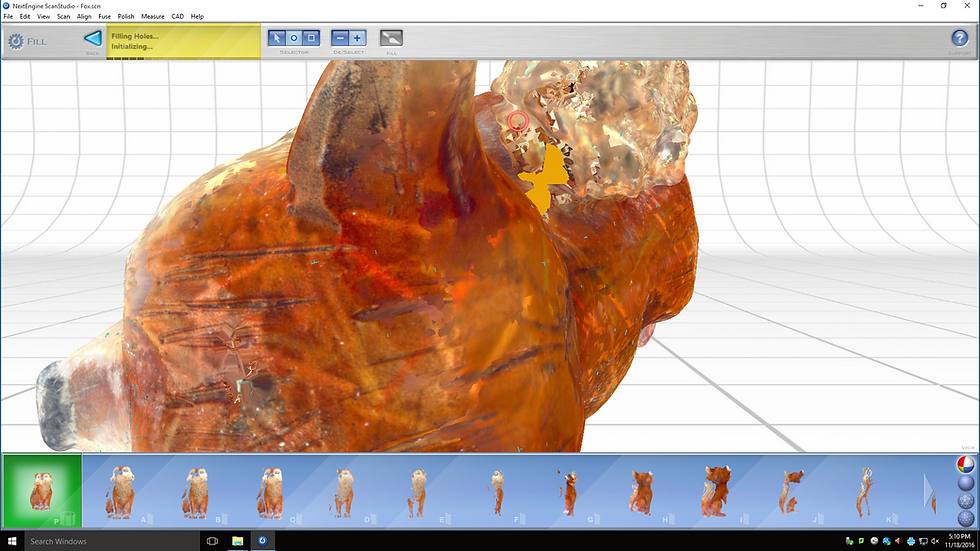
Many small holes remain, data is fused and polished with software tools.

The 'polish' function takes a long time. We still had persistent holes in data after this process.

Data Visualization for Historic Macon Foundation
After our class field trip to Macon, Georgia, two teams were created to explore creating a data visualization of the positive economic impact of historic preservation on Macon, with particular focus on the historic Beall's Hill neighborhood. The research team looked into different apps and softwares to effectively display and interpret the data.
The Story Maps team worked on putting together an Esri Story Maps preserntation for Historic Macon Foundation. Integral to this was learning the benefits and limitations of the various Story Maps platforms. The Story Maps team eventually settled on using the 'tour' and 'journal' formats of Story Maps, with the hopes of embedding one type of Story Map into the other. We also are exploring the 'swipe' and 'spyglass' platforms of Story Maps. If the basemaps used in online Story Maps are ArcGIS maps/Esri data, they update in real time automatically. Like all free websites, only certain functions are supported. With a paid subscription comes more options. Free use of Story Maps must be shared and published. All images/videos must be stored on public sites like Flickr, Picassa or YouTube.
All text work and research was shared amongst the team on Google Docs, so that all might contribute to and periodically review the project. The team was divided into groups, each with a different task: historic Macon research and text creation, CityMap extrusion, creation of Photoshop images and Story Maps page management. The Story Maps software may be used by only one person at a time, or changes will not be saved. This made a team effort on the map awkward at times. The team texted one another to alert the others when they were working on the Story Map.
Erin Ward was the Story Map's team point person for extruding data using the CityEngine 3D modeling for urban environments platform. From ArcMap: "Extrusion is the process of stretching a flat 2D shape vertically to create a 3D object. This provides a simple method to create three-dimensional symbology from two-dimensional features. For example, you can extrude building polygons by a height value to create realistic building shapes." Using CityEngine to create an extrusion map representing real estate values involved some computer coding language.
CityEngine, ArcGIS and Story Maps are owned by Esri, the geographic mapping company that produces these softwares. Using these platforms to interpret and present data combined with geography gives new insight into city development and planning.
From CityEngine's website: "Over the next few years, we see CityEngine becoming the desktop application of choice for city planners, urban designers, and architects. We will invest in advancing special-purpose capabilities such as procedural master planning tools, interactive urban analytics on the GPU, or the management, comparison, and communication of redevelopment scenarios. At the same time, we will continue to tightly integrate CityEngine with the ArcGIS 3D platform, namely, interconnect CityEngine with web apps such as Scene Viewer and Story Maps, and with VR/AR apps based on Runtime SDKs."
Our team used Story Maps software to develop what we hope will be an effective interactive tool that Historic Macon Foundation can link to their website and regularly update.
Here's the first iteration of a Story Map for Historic Macon Foundation: